





Marketing analytics enables a company to go from conjecture to facts about business decisions. It links activities like social media, advertising, email, content and search engine optimization to tangible results such as sales leads, orders, revenue, and customer retention.
For an Indian business, this can answer practical questions: Which campaign produces qualified leads? Is paid advertising generating profitable sales? Does organic traffic create revenue or merely page views? Which customer segment is most likely to purchase again?
Analytics cannot guarantee growth or explain every customer’s decision. When tracking is configured carefully, however, it provides a more reliable basis for planning campaigns, allocating budgets and testing improvements.
Table of Contents
What Are Marketing Analytics?
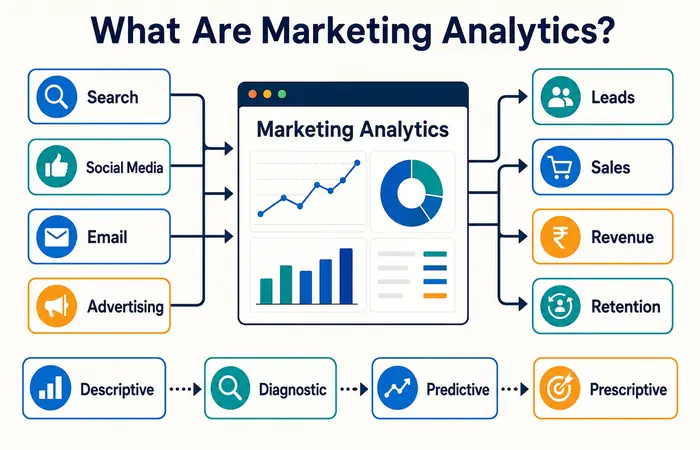
Marketing analytics is the structured practice of collecting, organizing and analyzing data from marketing channels to evaluate performance and guide future decisions.
It covers more than website traffic. An effective analytics system shows the link between marketing actions and some kind of desired business result. An e-commerce marketer might relate an Instagram ad to someone’s page-view, add-to-cart, and purchase. For a B2B business, that could be a link between the LinkedIn campaign and a fill-in form and sales call and signature.
The discipline normally involves four levels of analysis:
| Analytics level | Question answered | Example |
| Descriptive | What happened? | Website leads increased by 18% |
| Diagnostic | Why did it happen? | Organic traffic grew after new comparison pages ranked |
| Predictive | What may happen next? | Lead volume may fall when seasonal demand declines |
| Prescriptive | What should we do? | Reallocate part of the budget to the higher-converting channel |
Smaller businesses often begin with descriptive reporting. More mature teams use diagnostic, predictive and prescriptive analysis to support planning.
Why Marketing Measurement Matters
Today digital tools generate lots of information, but more data does not result in better decisions. Measurement’s ultimate intent: separating signal from the noise.
A properly designed framework can help a business:
- Understand where customers discover the brand
- Compare the cost and quality of leads by channel
- Identify weak points in the conversion journey
- Measure revenue influenced by different campaigns
- Improve audience targeting and campaign messaging
- Compare short-term campaign results with long-term value
- Forecast likely demand and budget requirements
- Detect tracking or performance problems early
Consider an Indian software company spending ₹5 lakh per month across Google Ads, LinkedIn, email and content. A channel-level report may show that Google Ads generates the most enquiries. When sales outcomes are added, the company may discover that content and email produce fewer enquiries but substantially higher contract values.
Without that connection, the business could increase spending on the channel producing the largest quantity of leads rather than the greatest commercial value.
Marketing Analytics Metrics That Actually Matter
The right metrics depend on the company’s business model and objective. A publisher, ecommerce store, mobile application and professional services firm should not use identical scorecards.
Reach and acquisition metrics
Reach metrics show how successfully a business attracts an audience.
There are plenty of common metrics such as impressions, reach, search visibility, website users, sessions, source of traffic and click-through rate. While these may be a good start at the top of the funnel, they should not be regarded as any sort of indicator of commercial success.
A campaign can generate one million impressions and still deliver no meaningful enquiries.
Engagement metrics
Engagement indicates whether people interact with the content or experience after arriving.
Relevant metrics can include engaged sessions, average engagement time, video completion, newsletter interaction, product views, scroll depth and return visits. The metric should reflect a meaningful behaviour rather than an easily inflated number.
A long average engagement time, for example, may indicate interest. It may also indicate that visitors cannot find the information they need. Context matters.
Conversion metrics
A conversion is a predefined action that represents progress towards a business goal. It may be a purchase, consultation request, account registration, application, app installation or newsletter subscription.
Important conversion metrics include:
- Conversion rate
- Cost per lead
- Cost per acquisition
- Lead-to-customer rate
- Cart abandonment rate
- Sales-qualified lead rate
- Revenue per visitor
Conversion rate can be calculated as:
The denominator should remain consistent across reports. Switching between users, sessions and clicks can create misleading comparisons.
Revenue and profitability metrics
Revenue metrics connect marketing activity with business performance.
| Metric | Basic calculation | Primary use |
| Customer acquisition cost | Sales and marketing cost ÷ new customers | Evaluating acquisition efficiency |
| Return on ad spend | Ad-attributed revenue ÷ advertising cost | Comparing paid campaigns |
| Marketing ROI | Marketing-generated profit ÷ marketing cost | Estimating overall profitability |
| Average order value | Revenue ÷ number of orders | Tracking transaction value |
| Customer lifetime value | Expected customer value over the relationship | Setting sustainable acquisition limits |
Return on ad spend and marketing ROI are related but not interchangeable. A campaign may have a healthy return on ad spend while remaining unprofitable after product, fulfilment, agency and operational expenses are included.
Retention and customer value metrics
Acquisition reporting receives considerable attention, but retention can be more valuable for subscription businesses, marketplaces and ecommerce brands.
Helpful metrics consist of repeat purchase rate, renewal rate, churn, purchase frequency, cohort retention and CLV. Cohort analysis can segment customers into an appropriate starting point, such as by first purchase month, and can be used to track the evolution of their behaviors overtime.
This helps separate recent growth from durable customer value.
A Practical Marketing Analytics Workflow
Analytics should operate as a continuous decision process rather than a monthly collection of charts.
1. Define the business decision
Begin with the question that a stakeholder needs to answer.
“Improve digital marketing” is too broad. Better questions include:
- Which channel should receive an additional ₹1 lakh next quarter?
- Why did qualified enquiries decline in July?
- Which content categories influence software-demo requests?
- Does a discount campaign attract customers who purchase again?
A clear question determines which data is required.
2. Select the objective and KPIs
Choose one primary outcome and a small set of supporting indicators.
The main KPI for a lead-gen campaign would be Sales Qualified Leads. Several secondary KPIs would also apply here and be landing page conversion rate, cost per lead, and a lead-to-meeting rate.
Avoid dashboards containing every available metric. A focused scorecard is easier to interpret and act upon.
3. Map the customer journey
Document the important stages from initial discovery to purchase and retention.
A simplified B2B journey might be:
Search impression → article visit → case-study view → demo request → sales meeting → customer
An ecommerce journey might be:
Advertisement → product view → add to basket → checkout → purchase → repeat purchase
The journey map reveals the events, campaign parameters and system integrations needed for measurement.
4. Create a tracking plan
The tracking plan should list each event, its definition, where it occurs and how it will be verified.
Use consistent UTM parameters for campaign links. Establish naming rules before campaigns launch. Variations such as facebook, Facebook, fb and meta-paid can fragment a single channel into several reporting rows.
Recommended event names should also be used where the analytics platform supports them. Google’s documentation notes that some events are collected automatically, while recommended and custom events require additional configuration to provide more useful reporting.
5. Collect and combine data
Marketing information commonly comes from:
- Website and application analytics
- Advertising platforms
- Search performance tools
- Customer relationship management systems
- Ecommerce platforms
- Email systems
- Social media platforms
- Call-tracking or offline sales records
- Customer surveys
For a small organisation, a spreadsheet or basic dashboard may be sufficient. A larger organisation may require a data warehouse, transformation process and business-intelligence platform.
6. Validate data quality
Before interpreting results, check whether the data is trustworthy.
Verify that events fire once, purchases include correct values, test transactions are excluded, campaign naming is consistent and internal staff traffic is handled appropriately. Compare analytics revenue with the ecommerce or accounting system.
The figures may not match exactly because the systems use different timing, identity and attribution rules. Large or unexplained differences require investigation.
7. Analyse and segment
Aggregate figures frequently hide useful patterns. Segment performance by device, geography, new versus returning customer, campaign, landing page, product category or customer cohort.
Suppose the overall conversion rate is 2.5%. Desktop traffic might convert at 4.2%, while mobile traffic converts at 1.3%. The problem is therefore not necessarily the entire campaign; it may be the mobile checkout or the quality of mobile traffic.
8. Form a hypothesis and run a test
Translate the finding into a testable statement.
For example: “Reducing the mobile checkout form from eight fields to five will increase completed purchases.”
Define the main metric, guardrail metrics, test duration and decision rule before reviewing results. Small samples can produce unstable changes, so avoid ending a test simply because an early result looks favourable.
9. Document the decision
A report should state what changed, why it matters and what will happen next. Useful reporting connects data with action:
Mobile paid-search conversion fell after a checkout update. Restore the previous address layout, test the revised experience and monitor successful payments for two weeks.
This is more valuable than displaying a conversion graph without interpretation.
Types of Marketing Analytics Tools
No single platform measures every interaction perfectly. Businesses normally use a connected toolset.
| Tool category | Best suited to | Typical outputs | Main limitation |
| Web and app analytics | On-site or in-app behaviour | Users, events, paths and conversions | Limited view of offline activity |
| Advertising analytics | Paid campaign optimisation | Spend, clicks and attributed conversions | Platform-reported bias |
| Social analytics | Audience and post performance | Reach, engagement and follower trends | Weak connection to final revenue |
| Content analytics | Organic content evaluation | Rankings, traffic, leads and assisted conversions | Longer measurement period |
| Email analytics | Campaign and lifecycle performance | Deliveries, clicks and conversions | Privacy features affect open rates |
| Attribution tools | Cross-channel credit allocation | Channel paths and conversion credit | Results depend on model and identity data |
| Customer analytics | Retention and value | Cohorts, churn and lifetime value | Requires reliable customer identification |
| Business-intelligence tools | Combined reporting | Custom dashboards and models | Setup and maintenance requirements |
Social media analytics tools
Using social media analytics solutions helps monitor reach, audience response, content performance and traffic to platforms. The Native dashboard should be sufficient to optimize on a day-to-day basis; using an analytics tool gives cross-platform insight into consistent reports.
Engagement should be interpreted against the campaign goal. Saves and shares may matter for educational content, while product-page visits, qualified leads or purchases are more relevant to a commercial campaign.
Free marketing analytics tools
Free marketing analytics tools will cater to most start-ups, publishers, and local businesses. Some typical free tools: – Google analytics- Google Search Console- native ad reports- social platform insights- spreadsheet dashboard
“Free” does not mean costless. Implementation, quality assurance, reporting and staff time still require resources. A free platform configured well is usually more useful than an expensive system with unreliable tracking.
AI marketing analytics tools
AI marketing analytics tools can help identify anomalies, summaries reports, forecast demand, group customers and suggest possible explanations for performance changes.
Their output must still be reviewed. The AI might find correlation but not causation. It might not know about tracking errors and may confabulate out of insufficient data. No sensitive information should be loaded into an AI service without prior verification of its terms regarding privacy, security and retention.
Content marketing analytics tools
Content marketing analytics tools connect search visibility and reader behaviour with outcomes such as email sign-ups, enquiries and assisted conversions.
Useful content measurements include non-branded impressions, organic clicks, engaged visits, returning users, conversion assists and topic-level performance. Ranking alone is not enough. A page can rank for a low-value query that attracts users who are unlikely to become customers.
Email marketing analytics tools
Email marketing analytics tools report delivery, clicks, unsubscribes, conversions and automation performance. Open rates have become less reliable because privacy features can automatically load tracking pixels.
Click activity, replies, website behaviour, purchases and subscription changes generally provide stronger evidence of campaign value. Email lists should also be segmented so that new subscribers, active customers and inactive contacts do not receive identical communication.
Marketing attribution tools
Marketing attribution tools assign conversion credit to advertising, clicks and other touchpoints in the customer journey. Google defines attribution as assigning credit to the factors along a user’s path to a meaningful action.
Common models include:
| Attribution model | How credit is assigned | Useful when | Limitation |
| First-click | First known touch receives credit | Studying initial discovery | Ignores later influence |
| Last-click | Final touch receives credit | Simple conversion reporting | Undervalues earlier activity |
| Linear | Credit is divided across touches | Recognising the full path | Assumes equal influence |
| Position-based | More credit to first and final touches | Acquisition and closing both matter | Weighting is arbitrary |
| Data-driven | Model estimates contribution from available data | Sufficient data and reliable tracking exist | Less transparent and data-dependent |
| Marketing mix modelling | Uses aggregated spend and outcome patterns | Measuring online and offline investment | Requires expertise and sufficient history |
| Incrementality testing | Compares exposed and control outcomes | Estimating causal lift | Can be costly or difficult to design |
Attribution is an estimate rather than a complete record of human influence. Privacy choices, cross-device behaviour, offline conversations and untracked sharing create unavoidable gaps.
Building a Marketing Dashboard
A dashboard should communicate the state of the business quickly. It should not resemble a storage area for every available chart.
A practical executive dashboard may contain:
- Marketing spend
- Qualified leads or transactions
- Customer acquisition cost
- Conversion rate
- Revenue influenced by marketing
- Channel-level performance
- Trend versus target and previous period
- A short explanation of material changes
Operational teams may need more detailed dashboards for campaign, creative, search term, landing-page or audience analysis.
Every metric should include a clear definition. For instance, a “lead” might mean any submitted form to one team and a verified sales opportunity to another. Without a shared definition, departments can report different results from the same activity.
Practical Use Cases for Indian Businesses
Local service company
A clinic, legal practice or home-service company can connect search campaigns with calls, forms and confirmed appointments. Its priority should be qualified enquiries and acquired customers, not clicks alone.
Ecommerce brand
A website can track product viewing, adding products to cart, completing payment, average order value, and repurchase rates. By segments based on region, device, or payment method, one can pinpoint where checkout is frustrating.
B2B software company
A software company can combine content, paid media, webinar and CRM records. This enables analysis of pipeline value and sales outcomes instead of relying only on form submissions.
Publisher or affiliate website
A publisher can compare search visibility, engaged readership, affiliate clicks and revenue by content cluster. This supports decisions about which topics deserve updates or expansion.
Omnichannel retailer
A retailer with online and physical stores may combine campaign, loyalty and point-of-sale data. This is more complex because an online advertisement can influence an offline purchase without producing a directly observable path.
Data Privacy and Responsible Measurement in India
Marketing measurement can involve identifiers, device information, contact details and behavioural data. Businesses operating in India should review their obligations under applicable privacy, consumer and sector-specific rules, including the Digital Personal Data Protection Act and its implementation requirements.
Responsible practice includes:
- Collecting data for a defined and communicated purpose
- Obtaining valid consent where required
- Avoiding unnecessary personal data
- Restricting access according to job responsibility
- Establishing retention and deletion procedures
- Reviewing vendor contracts and data locations
- Providing mechanisms for relevant user choices
- Applying additional safeguards to sensitive information
Google’s developer guidance states that organisations using its analytics products are responsible for complying with applicable privacy laws and obtaining necessary consent. It also explains that Consent Mode can adjust tag behaviour according to a user’s consent choice. This technical feature does not replace legal review or a properly designed consent process.
Benefits and Limitations of Marketing Analytics
Main benefits
Analytics creates a common evidence base for marketing, sales and management. It can expose inefficient spending, identify valuable audiences and improve the speed of campaign decisions.
It also supports organisational learning. When tests, results and decisions are documented, teams are less likely to repeat unsuccessful approaches.
Important limitations
Marketing data is never a perfect representation of customer behaviour. Tracking prevention, consent choices, deleted cookies, cross-device journeys, offline recommendations and platform restrictions create missing information.
Other limitations include:
- Different systems using different attribution rules
- Duplicate or incorrectly configured events
- Platform-reported results exceeding independently measured results
- Short evaluation windows that undervalue brand building
- Correlation being mistaken for causation
- Small samples producing unstable conclusions
- Excessive focus on measurable digital activity
- Dashboards encouraging observation without action
Analytics narrows uncertainty; it does not eliminate it.
What Results Should Businesses Realistically Expect?
A new analysis may require several weeks before the data is consistent enough for routine decisions. Advanced attribution, customer lifetime value analysis and forecasting usually require more history and stronger system integration.
A small business should not expect a tool to automatically reveal the perfect campaign. Early value often comes from basic improvements: correcting broken conversion tracking, identifying an expensive low-quality channel or discovering that a mobile form is difficult to complete.
Attribution totals from advertising platforms, website analytics and CRM systems may differ. This is not automatically evidence that a platform is broken. The systems can use different conversion windows, time zones, identity methods and credit rules.
Reliable analysis should use ranges, trends and corroborating evidence where precise certainty is unavailable.
How to Start with a Limited Budget
Begin with one important business outcome. Install or audit website analytics, establish campaign naming rules and connect leads or purchases to their original source where practical.
A sensible starter process is:
- Select one primary conversion.
- Document its exact definition.
- Verify tracking on desktop and mobile.
- Create consistent campaign parameters.
- Compare platform results with actual sales records.
- Build a one-page weekly scorecard.
- Investigate one important change each week.
- Record the action and its subsequent outcome.
Add new tools only when they solve a defined limitation. Purchasing an enterprise platform before establishing reliable definitions and processes normally increases complexity rather than insight.
Frequently Asked Questions
In simple terms, what is marketing analytics?
It is the practice of using data to understand marketing performance. It can help a business relate its marketing activities and customer behavior to its outcomes (e.g. Inquiries, purchases, revenue and retention).
What is the difference between marketing analytics and web analytics?
Web analytics track behavior while it occurs within a website or application. Marketing analytics is broader; it includes advertising, email, social content, CRM data, offline performance, revenue and customer lifetime value.
What metrics should a small business monitor?
A business should start by tracking leads or purchases, conversion rate, cost per acquisition, revenue and channel performance. Only add more data once there’s a clear need to make a specific decision using it.
Are free analytics tools sufficient?
For a small/moderately complicated website they can be sufficient; the quality of implementation often trumps subscription value. However, businesses with multiple systems, offline sales or multiple customer touchpoints will require stronger integration eventually.
Can analytics determine the cause of a sale?
An estimation can be made as to the contribution of each marketing touchpoint, but true causality is hard to establish. Attribution models (using rules or statistics) or incrementality tests (which involve experimenting with sending random traffic to different versions of the user experience) are best suited.
How often should marketing reports be analyzed?
Operational campaign data might be checked daily, but the impact of campaigns overall is typically assessed weekly or monthly. Decisions should be based on a customer’s sales cycle and reasonable sample size, not short-term fluctuations.
Can analytics be applied to an offline business?
Absolutely. Offline businesses can connect their marketing efforts to outcomes such as telephone calls, offer redemption codes, booking information, points-of-sale data or customer surveys. The methods are often less direct; however, they can support effective decisions.
Conclusion
What Marketing analytics really boils down to – reliably good data linked to an actionable business decision; is not about huge dashboard or to buy the fanciest of analytic suites, but about reliable definitions, test tracking in place and a system to operationalize our learning.
For Indian businesses it translates to starting off with a clear outcome, making sure one joins the available marketing data with real sales and customer data, attributing sales as educated estimations. At the core, consistent verification, sound data practices and pragmatism are all you need for an analytical effort to improve budget allocation, make better customer definitions and deliver overtime results you can believe and depend on for your marketing.
Marketing Analytics Resource Hub
Explore essential marketing analytics guides, tools and resources for measuring and improving marketing performance.
Marketing Analytics
A complete guide to measuring, analysing and improving marketing performance.
Social Media Analytics Tools
Measure audience growth, engagement and social media campaign results.
Free Marketing Analytics Tools
Explore free tools for tracking and analysing marketing performance.
AI Marketing Analytics Tools
Discover AI-powered tools for insights, forecasting and optimisation.
Content Marketing Analytics Tools
Evaluate content traffic, engagement, leads and conversions.
Email Marketing Analytics Tools
Track email delivery, clicks, conversions and subscriber behaviour.
Marketing Attribution Tools
Understand customer journeys and assign credit across marketing channels.